Project: Zillow
Real Estate Professional Health Dashboard
Zillow
An executive dashboard for Zillow that monitors the health of relationships with real estate professionals, addressing a key business risk identified in their 10-K.
Project Demo
Project Metrics
Project Details
The Real Estate Professional Health Dashboard provides early warning of potential churn, enables targeted interventions, and helps Zillow maintain strong relationships with real estate professionals who contribute significantly to revenue. It includes segmentation analysis and simulation features for testing interventions.
Business Value
- Analytics
- Risk Management
- Relationship Monitoring
- Churn Prevention
Key Features
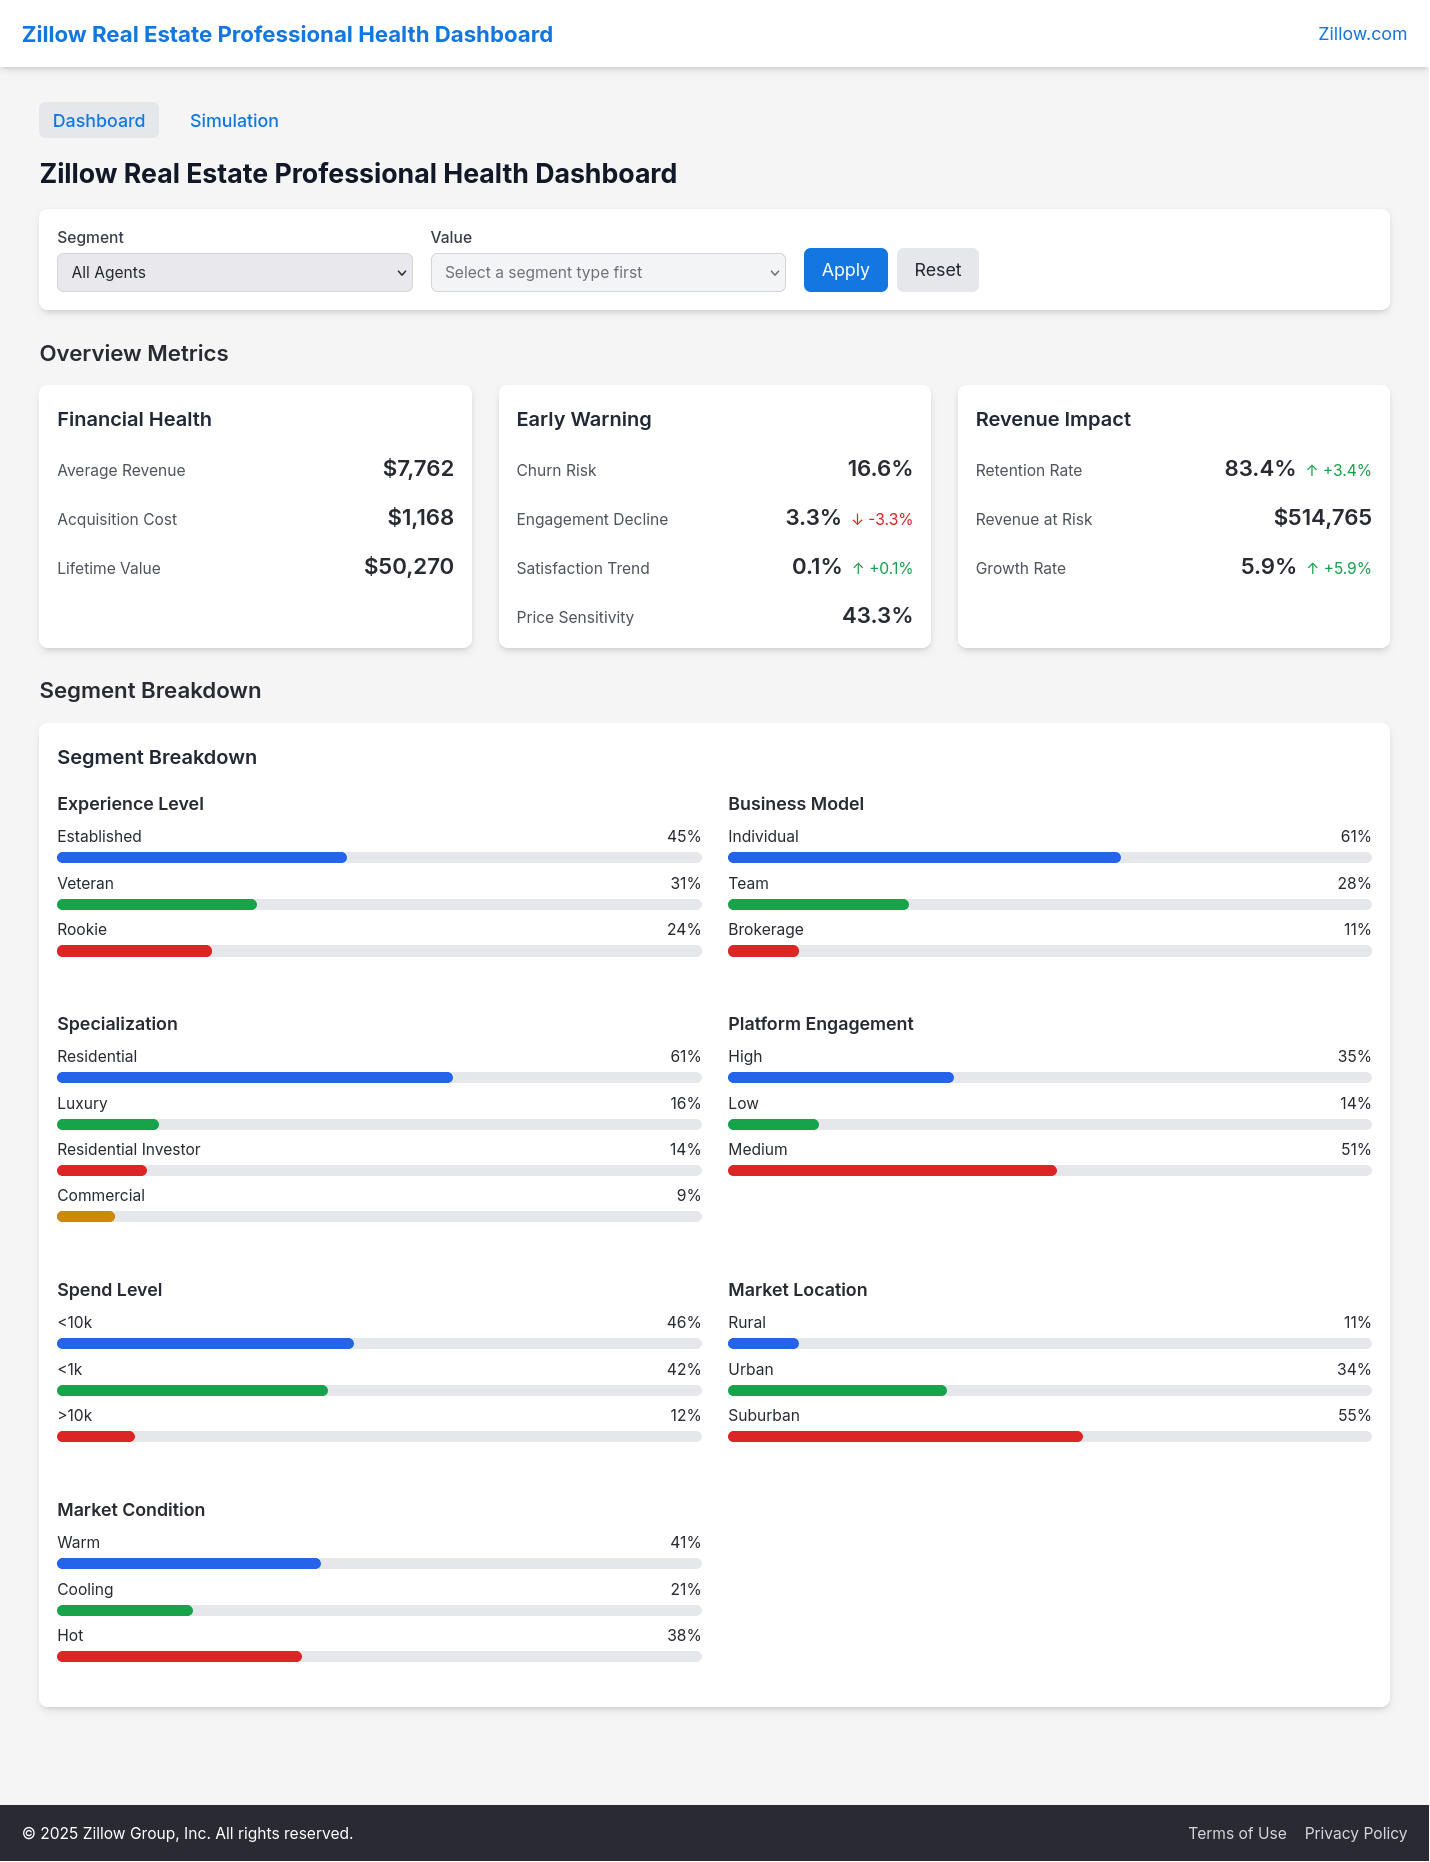
Agent Health Monitoring
Real-time tracking of key metrics for real estate professional relationships, with early warning indicators for potential churn.
Segmentation Analysis
Detailed segmentation of real estate professionals by type, region, performance, and engagement level for targeted interventions.
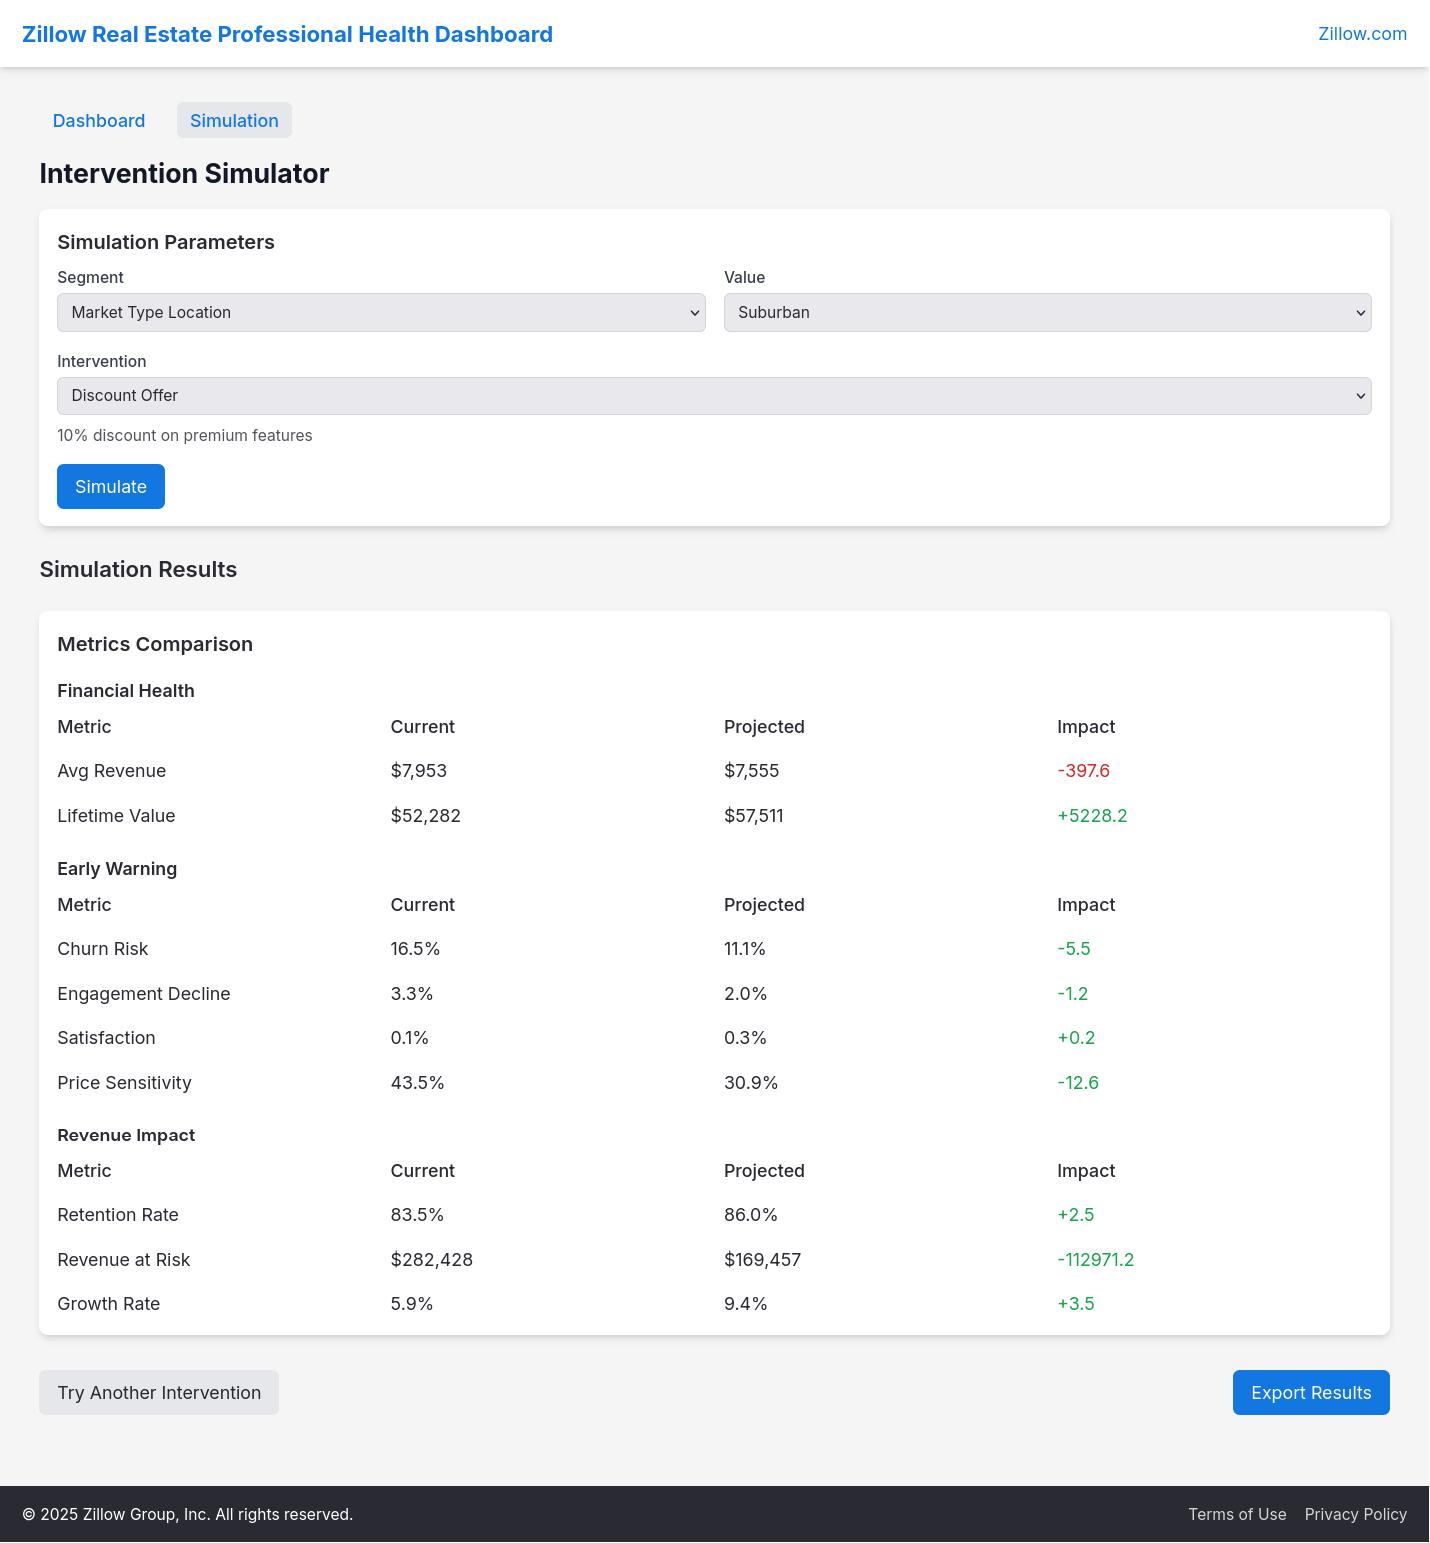
Intervention Simulation
What-if analysis tool for testing different intervention strategies before implementing them in the real world.
Executive Dashboard
Comprehensive visualization of key metrics with drill-down capabilities for deeper analysis and decision support.
Technologies Used
Frontend
Backend
DevOps
Other
Challenges & Solutions
Implementing effective data aggregation for different agent segments
Loaded all agents into memory and performed aggregations in the backend, which works well for the demo's limited dataset but would need optimization for production.
Creating an intuitive simulation interface for what-if analysis
Implemented thoughtful UI design and color coding to clearly show the impact of interventions on different metrics.
Handling different color highlighting logic for different types of metrics
Created separate highlighting logic for metrics where higher values are better versus metrics where lower values are better.
Key Learnings
- The importance of understanding business risks and how technology can address them.
- The value of segmentation in data analysis for targeted interventions.
- Effective use of AWS CDK for infrastructure as code.
- The power of simulation for testing interventions before implementation.
- The need to consider different color highlighting logic for different types of metrics.